
Data Analyst Roadmap 2026: Complete Step by Step Guide to Become a Data Analyst (With Salary)
Become a Data Analyst in 2026 with this complete roadmap. Learn SQL, Excel, Python, Power BI, statistics, and data visualization with timeline, certifications, and salary guide.
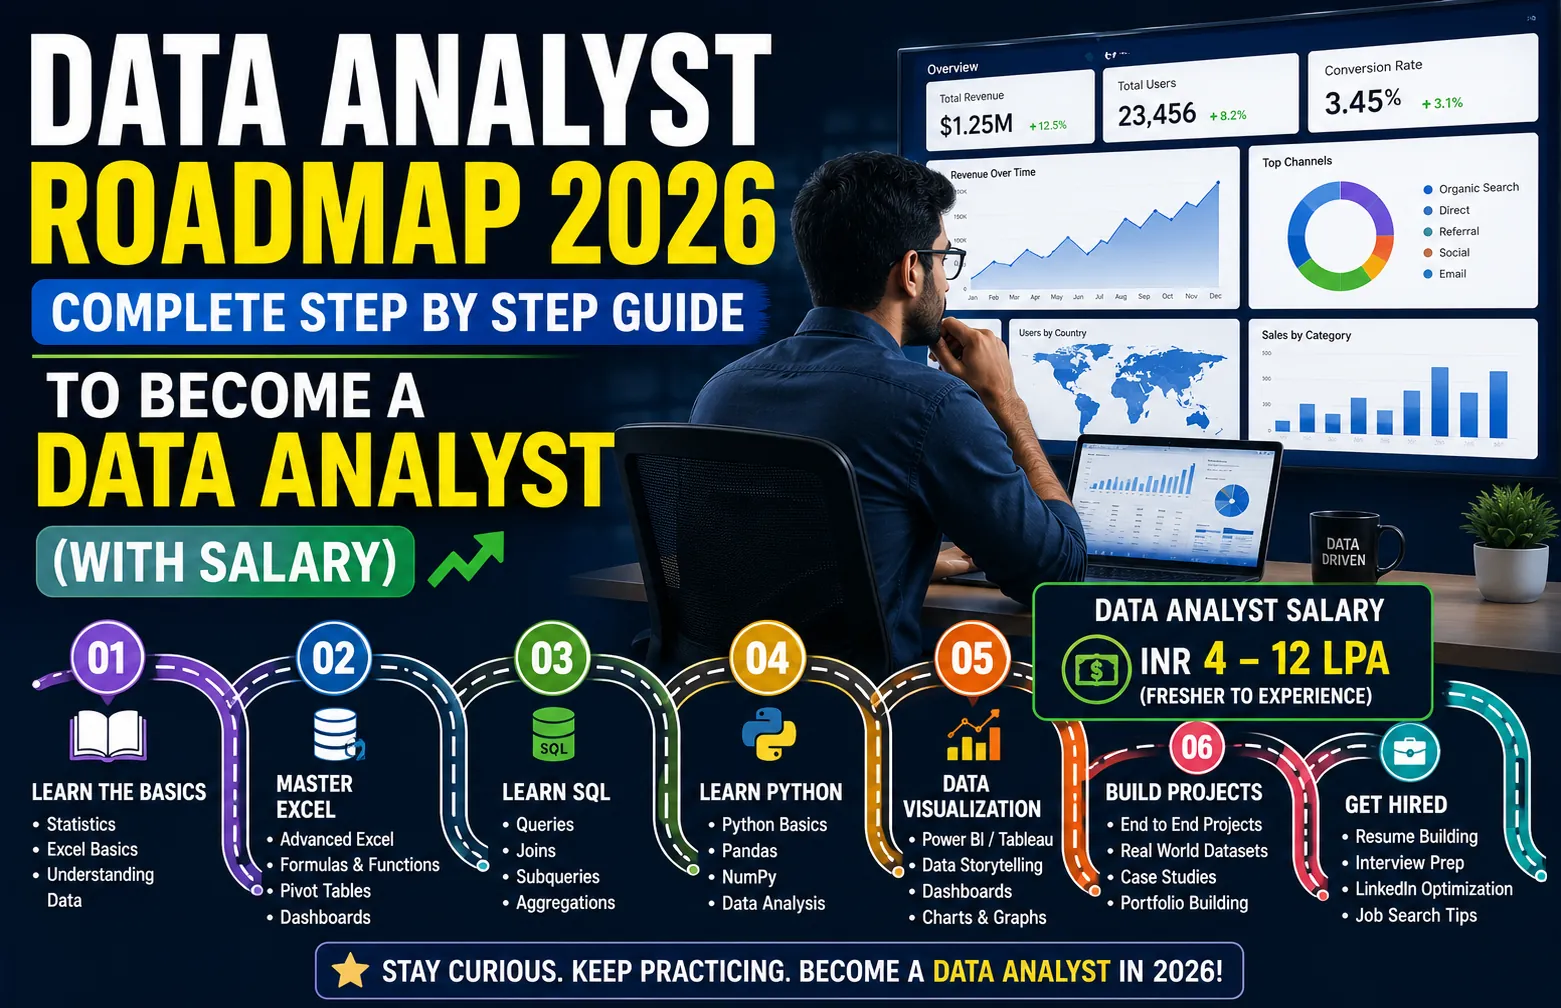
Learning Path
Follow these steps in order to master the skill
Before You Start
Basic computer skills
Logical thinking ability
Interest in numbers and patterns
Willingness to learn new tools daily
Step 1Excel Mastery
2 months
Excel Mastery
Master Excel formulas (VLOOKUP, INDEX MATCH, SUMIFS), Pivot Tables, charts, and Power Query. Excel is still the most used tool in business analytics worldwide.
Step 2SQL Fundamentals
2 months
SQL Fundamentals
Learn SELECT queries, JOINs, GROUP BY aggregations, subqueries, CTEs, and window functions. Practice daily on SQLZoo, HackerRank, and LeetCode.
Step 3Python for Data Analysis
2 months
Python for Data Analysis
Master Pandas for data manipulation, NumPy for numerical computing, Matplotlib and Seaborn for visualization. Learn to read files, clean data, and create analysis scripts.
Step 4Statistics and Data Visualization
2 months
Statistics and Data Visualization
Understand descriptive statistics, probability basics, hypothesis testing, and correlation concepts. Learn Power BI or Tableau for creating professional dashboards.
Step 5Real World Projects
2 months
Real World Projects
Build 4-6 portfolio projects using real datasets from Kaggle. Create dashboards, write analysis reports, and host your work on GitHub and portfolio platforms.
Step 6Certifications and Job Preparation
2 months
Certifications and Job Preparation
Earn Google Data Analytics Certificate, prepare your resume, build a strong portfolio, and start applying for entry level Data Analyst positions.
Skills You'll Master
8 skills you'll acquire through this roadmap
About This Roadmap
Data Analyst Roadmap 2026: Complete Guide to Become a Data Analyst
Data is everywhere and Data Analysts are the ones who turn it into decisions. Every company, from Amazon to your local kirana store going online, collects data. But raw data is useless until someone makes sense of it. That's exactly what a Data Analyst does.
The best part about this career? You don't need a Computer Science degree, you don't need advanced math, and you don't need years of experience. With the right roadmap and 3-4 hours of daily practice, you can become job ready in 9-12 months.
LinkedIn consistently ranks Data Analyst among the top 10 most in-demand jobs globally. In India alone, there are over 1.5 lakh unfilled data analyst positions. Companies are hungry for people who can look at data and find patterns.
What You'll Learn:
- Excel for quick analysis and reporting
- SQL for extracting data from databases
- Python for advanced data processing
- Statistics for making correct conclusions
- Power BI and Tableau for dashboards
- Real projects for your portfolio
- Certifications that boost your resume
- Salary expectations and growth path
Data Analyst vs Data Scientist What's the Difference?
Before starting, it's important to understand the difference. Many people confuse these two roles.
| Aspect | Data Analyst | Data Scientist |
|---|---|---|
| Focus | Existing data se insights nikalna | Future predictions ke liye models banana |
| Core Work | Reports, dashboards, SQL queries | ML models, AI algorithms |
| Math Level | Basic statistics | Advanced statistics + Linear Algebra |
| Skills | SQL, Excel, Power BI, Basic Python | Python, ML, Deep Learning |
| Salary (India) | ₹5-15 LPA | ₹12-35 LPA |
| Difficulty | Easier to start | Harder, needs more math |
Data Analyst is the perfect entry point. Once you master analytics, you can always transition to Data Science later.
Month 1-2: Excel Mastery
Most people ignore Excel, thinking it's basic. That's a mistake. Excel is still the most widely used analytics tool in business. Even at Amazon and Google, analysts use Excel daily for quick analysis.
| Skill | What to Learn | Why It Matters |
|---|---|---|
| Formulas | VLOOKUP, INDEX MATCH, SUMIFS, COUNTIFS | Quick data manipulation |
| Pivot Tables | Data summarization, grouping | Fast analysis without coding |
| Charts | Bar, line, pie, scatter plots | Visual representation |
| Power Query | Data cleaning, transformation | Automate repetitive tasks |
Practice Tip: Download free datasets from Kaggle and analyze them in Excel. Create 5-10 practice reports before moving on.
Month 3-4: SQL The Non-Negotiable Skill
SQL (Structured Query Language) is the language of databases. Every single Data Analyst job requires SQL. No exceptions. If you learn only one skill from this roadmap, make it SQL.
| Topic | Commands | Difficulty |
|---|---|---|
| Basic Queries | SELECT, WHERE, ORDER BY, LIMIT | Easy |
| Joins | INNER, LEFT, RIGHT, FULL OUTER | Medium |
| Aggregation | GROUP BY, HAVING, COUNT, SUM, AVG | Easy |
| Subqueries | Nested queries, CTEs | Medium |
| Window Functions | ROW_NUMBER, RANK, DENSE_RANK, LAG | Advanced |
Practice Platforms: SQLZoo (free), HackerRank (free), LeetCode (free + paid), StrataScratch (paid but worth it).
Pro Tip: Practice SQL daily even 30 minutes is enough. Consistency beats intensity when learning SQL. Window functions are what separate good analysts from average ones.
Month 5-6: Python for Data Analysis
Python takes your analytics skills to the next level. While Excel and SQL handle most tasks, Python lets you automate everything and handle massive datasets effortlessly.
| Library | Purpose | Time Needed |
|---|---|---|
| Pandas | Data manipulation and analysis | 3-4 weeks |
| NumPy | Numerical computations | 2 weeks |
| Matplotlib | Basic data visualization | 2 weeks |
| Seaborn | Statistical visualizations | 2 weeks |
What to learn with Pandas: Reading CSV/Excel files, filtering data, grouping, merging datasets, handling missing values, and creating pivot tables in Python.
Month 7-8: Statistics and Data Visualization
Data without statistics can lead to wrong conclusions. Understanding basic statistical concepts ensures your analysis is correct and reliable.
Key Statistical Concepts:
- Descriptive Statistics: Mean, median, mode, standard deviation, variance
- Probability: Basic probability, normal distribution
- Hypothesis Testing: T-tests, chi-square tests, p-values
- Correlation vs Causation: Understanding the difference
Data Visualization Tools:
| Tool | Best For | Difficulty |
|---|---|---|
| Power BI | Business dashboards, reports | Easy |
| Tableau | Interactive visualizations | Easy |
| Google Data Studio | Free dashboards | Very Easy |
Tip: Learn one tool deeply first. Power BI is the most in-demand in India. Tableau is more popular globally. Pick based on your target market.
Month 9-10: Real-World Projects
Certificates don't get you jobs projects do. Employers want proof that you can solve real problems with data. Here are projects to build:
| Project | Skills Demonstrated | Difficulty |
|---|---|---|
| Sales Analysis Dashboard | SQL + Power BI | Easy |
| Customer Segmentation | Python + Clustering | Medium |
| E-commerce Analytics | Full pipeline (SQL→Python→Dashboard) | Medium |
| COVID-19 Data Analysis | Public datasets, visualization | Easy |
| Marketing Campaign Analysis | Excel + SQL + Statistics | Medium |
Portfolio Tips: Host code on GitHub. Create dashboards on Power BI Service or Tableau Public. Write LinkedIn posts explaining your analysis. Create a simple portfolio website.
Month 11-12: Certifications and Job Preparation
| Certification | Platform | Cost | Value |
|---|---|---|---|
| Google Data Analytics Certificate | Coursera | $39/month | Very High most recognized |
| Microsoft Power BI Certification | Microsoft | $165 | High for BI roles |
| SQL Certification | HackerRank | Free | Medium proves SQL skills |
| IBM Data Analyst | Coursera | $39/month | High comprehensive |
Complete 12-Month Timeline
| Months | Focus | Key Skills |
|---|---|---|
| 1-2 | Excel | Formulas, Pivot Tables, Power Query |
| 3-4 | SQL | Queries, Joins, Window Functions |
| 5-6 | Python | Pandas, NumPy, Visualization |
| 7-8 | Statistics + BI | Descriptive stats, Power BI |
| 9-10 | Projects | Portfolio building |
| 11-12 | Certifications | Job preparation |
Salary Expectations
| Level | India (LPA) | Global (USD) |
|---|---|---|
| Entry Level (0-2 years) | ₹5-8 LPA | $70,000-90,000 |
| Mid Level (3-5 years) | ₹12-20 LPA | $100,000-130,000 |
| Senior Level (5+ years) | ₹25-50 LPA | $150,000-180,000 |
Conclusion
Data analytics is one of the most accessible and rewarding careers in tech. You don't need a computer science degree. You don't need advanced math. You don't need years of experience. What you need is curiosity, consistency, and the willingness to practice daily.
Start with Excel. Master SQL. Learn Python. Build projects. Earn certifications. Within 12 months, you can land your first data analyst job and begin your journey in one of the most in-demand fields in the world.
The data is out there. The insights are waiting. Are you ready to analyze?
Recommended Resources
Curated materials to accelerate your learning
Google Data Analytics Professional Certificate
SQLZoo Free SQL Practice
HackerRank SQL Practice
Kaggle Free Datasets and Tutorials
Power BI Learning Portal
Pandas Official Documentation
Alex The Analyst YouTube Channel
LeetCode SQL Problems
Tableau Public Free Dashboard Platform
Frequently Asked Questions
Common questions about Data Analyst Roadmap 2026: Complete Step by Step Guide to Become a Data Analyst (With Salary)
01Can I become a Data Analyst without a degree?
02How long does it take to become a Data Analyst?
03Is SQL really necessary for Data Analyst jobs?
04What is the difference between Data Analyst and Data Scientist?
05Which tool should I learn first Power BI or Tableau?
06Do I need to know Python for entry level Data Analyst jobs?
07What projects should I build for my Data Analyst portfolio?
Learner Reviews
Share your learning experience